
- Corn 6 to 7 ½ higher
- Soybeans 3 to 4 higher
- Wheat 13 ½ to 17 ½ higher
- Basis Flat
- Live Cattle 63 higher (250.93)
- Dow Jones 60 lower (51,985)
- Crude Oil 50 higher (75.77)
- Feeder Cattle 60 higher (367.48)
Confirmation of Tuesday’s Chinese bean purchases helped markets add to yesterday’s gains and further emphasize the developing market bottom. Although China was not mentioned specifically in the daily export report, Unknown was assumed to be China. At today’s highs, corn was about 15-cents from Monday’s low while beans were 37-cents and wheat an impressive 43-cents, adding support that the funds are done selling with plenty of end users standing in line to buy the break. Thursday will be the last trading day of the week (Friday is the Juneteenth holiday) and see the weekly export report, more rhetoric from both sides ahead of Friday’s peace deal signing with Iran and (potentially) the first across the board weekly gains for only the second time in the last two months.
News and Notes:
- Cooler but wet weather is forecast for most of the Midwest and Corn Belt for the next week, which will be moderately helpful. With waterlogged beans and yellowing corn in the wettest areas, the crops are in desperate need of a lot of growing degree days. The European drought and heat wave continues with crop stress reported in the major production areas. If Europe goes from net exporter to net importer, the world balance sheet will tighten a little more.
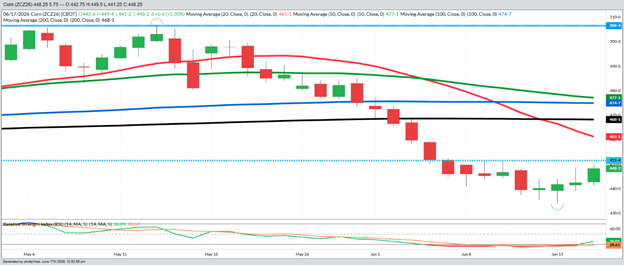
- The daily May 1st to today December corn chart is on Page 2 and shows the welcome reversal over the last 4-days. Monday’s trade of a lower opening and higher close is a key formation after the funds sold off over 1.5 BBU and took the markets to an extremely oversold condition. The key number to watch for Thursday’s weekly close (remember markets are closed on Friday) is if Dec corn close over last week’s high of $4.51 ½ (light blue dotted line). Monday’s daily spike reversal bottom and a weekly reversal would technically set up a run to the 20-DMA (red line) at $4.61 and then layers of moving average resistance up to $4.77. The funds are now just barely long the corn market, which means there is plenty of money on the sideline if the bullish news continues. Today’s close was $4.4xcvg?
- There was so much to talk about in the weekend comment, we ran out of room to put in our latest podcast with Helena. Please take a few minutes to listen.
- Tuesday’s rumors of Chinese interest in US beans proved accurate as the USDA announced this morning a sale of roughly 16 MBU to “unknown” destinations which is always assumed to be China for flexibility of delivery. Thursday’s export report should continue to see solid corn sales with the bean sales column a potential bullish surprise.
- I have growing confidence that the fund selloff lows are in place after the ugly early June trade and the apparent start of China living up to the trade deal. With great cash sales totals and %’s made during the spring rallies, I am recommending buying the September short-dated Corn $4.50/$5.00 call spread for roughly 13-cents plus commission. These options will expire August 21st to get you through the acreage report on June 30th, US pollination, and China hopefully coming into the US corn export market. Each of these things could be bullish for another 20-30 cent rally, but any combination of 2 of the 3 or the homerun of 3 for 3, would add another 40-50 cents to current prices. The total risk (including fees and commission) is about $750 per contract (5000 bu) and gives you the ability to sell additional bushels knowing that you are protected to December futures going to $5.13. These are commonly called “courage calls” and allow you the flexibility to potentially add premium to the previously sold bushels and/or give you confidence to sell more and not be worried about a corn rally continuing. Please call us about the trade and if opening an account makes sense for your operation.
The last true demand rally started in September of 2020 after seven difficult months of dealing with Covid. China began to show up as a buyer in a long succession of daily reports. In 2020 it was mainly corn, but if China is truly going to live up to the trade deal, they should start steadily purchasing both. If China is going to hit the 25 MMT annual bean agreement, they need to start buying 1 MMT (36.7 MBU) of beans every week to the end of the year. The corn number would be lower but still 15 MBU a week on average. This year is shaping up as another “not sure we saw this coming” type of year after the war and $100 crude gave us $5 corn and $12 beans and then after the massive fund inspired selloff, the sprouts of a potential extended demand rally seem to be popping up. The last 6 ½ months of 2026 should be interesting and hopefully peaceful and profitable.
Sales Targets
Corn
Beans
Wheat
- 2025 Crop Finished Finished Finished
- 100% Sold at $4.48 Avg 100% Sold at $10.67 100% Sold at $6.24 Avg
- 2026 Crop On Hold - Dec ‘26 On Hold – Nov ‘26 On Hold– July ‘26
- 60% Sold at $4.78 50% Sold at $11.05 65% Sold at $6.24
- Current Price $4.49 $11.51 $6.14
- 2027 Crop 10% at $5.15 - Dec ‘27 On Hold – Nov ‘27 On Hold– July ‘27
- No Sales Yet 10% Sold at $11.50 25% Sold at $7.15
- Current Price $4.78 $11.34 $6.62
%’s are total of expected yields. Bold Prices are Updated Sales Targets. * price includes trading
December Corn– Daily
Today’s Market Closes — Rounded to the Nearest Cent
Corn
- July $4.21
- September $4.30
- December $4.49
- March $4.63
Beans
- July $11.34
- September $11.38
- November $11.51
- January $11.64
Wheat
- July $6.14
- September $6.22
- December $6.37
- March $6.50
Other Closes
- August Diesel 3.1436 +190
- Dec Cotton 79.70 +195
- Cash Cattle $260 Offer
- Lean Hogs 96.55 +150
Any decision to purchase or sell as a result of the opinions expressed in this report will be the full responsibility of the person authorizing such transaction. No market data or other information is warranted by Reliance Capital Markets II LLC as to completeness or accuracy, express or implied, and is subject to change without notice. Any comments or statements made herein do not necessarily reflect those of Reliance Capital Markets II LLC, or their respective subsidiaries, affiliates, officers or employees. Disclaimer: Past performance is not indicative of future results. Strategic Trading Advisors is a registered DBA of Reliance Capital Markets ll LLC.

About Jody Lawrence
Jody Lawrence has been in the commodity brokerage and agriculture marketing business since 1992 and started Strategic Trading Advisors in 1999 and runs it today with his son Brady. The daily market comment his company publishes has over 7000 subscribers in 33 states and 3 countries and provides a concise overview of the world markets with ideas on farm hedging and marketing. Jody also travels the country giving 60-70 marketing meetings a year through his 22-year strategic partnership with Helena Agri-Enterprises.

About Brady Lawrence
Brady Lawrence is an Agriculture Market Specialist and Financial Advisor that focuses on commodities markets, futures and options brokerage, and helping individuals and families plan for retirement and their financial futures. Brady joined Jody at Strategic Trading Advisors in 2018 after college and supports the market research and brokerage sides of the business.