
- Corn 7 ½ to 8 ¾ lower
- Soybeans 3 ½ to 5 ½ lower
- Wheat 9 ¾ to 10 ¾ lower
- Basis Flat
- Live Cattle 80 lower (237.63)
- Dow Jones 549 lower (52,645)
- Crude Oil 328 higher (73.70)
- Feeder Cattle 165 higher (362.30)
The outside world jumped back into all market trade today as the US heavily bombed more Iranian military infrastructure after their recent attacks on ships in the Straits. In early trade, crude was 6% higher with diesel rallying almost 50-cents a gallon as the energy markets added back Straits closure risk. While crude rallies helped rally corn and beans and the renewable fuel markets earlier this year, the corn and bean markets were lower on farmer selling and a cooler noon forecast. The grain and bean markets will not be totally immune to what happens with Iran, but today’s trade makes it clear they are much less attached to energies daily movement. The confirmation of the Chinese bean purchases on Monday was announced this morning by the USDA, but the rumors of an additional similarly sized purchase overnight did not spark any buying. Chinese actions toward buying more US bushels and each new US weather forecast will continue to have oversized influence for the next month. Friday’s July USDA report looms but is normally not a major market mover.
News and Notes:
- The mid-day forecast offered a cooler outlook for next week with the heat dome pulling back to the Rockies instead expanding east. Ohio Valley flooding remains a problem with southern Indiana, Illinois and western Kentucky nearing the end of the replant window. Europe has past the point of no return and terrible yield forecasts will begin to mount for their crops.
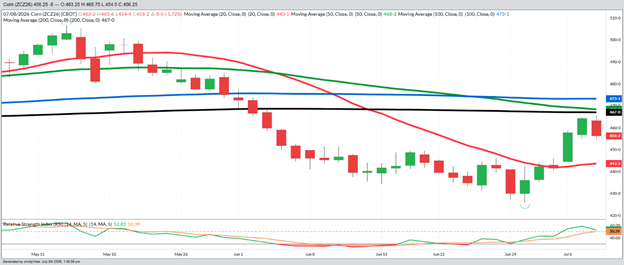
- The daily December corn chart is on Page 2 and after Monday’s bullish breakout, prices ran into a cluster overhead technical resistance starting with the 200-DMA (black line) at $4.67, with the 50-DMA (green) and 100-DMA (blue) just 1 penny and 6-cents over the 200-DMA. The funds moved back toward flat in today’s trade, so there is plenty of cash on the sidelines if a weather forecast sets up a test and potential upside breakout through those levels.
- The USDA daily export sales report confirmed China’s Monday bean purchases of 17 MBU with 1/4 for 25/26 and the rest for 26/27. The market did not “sell the fact” today which is a good sign. Rumors were for more purchases in the works, but the 10% tariff has not been dropped yet.
- With three weeks of crop ratings, our Wingman yield model has enough information to begin to narrow down to a prospective yield for corn. It is too early for bean ratings to have any correlation to final yield. Our basic premise is that for a 183 national yield to be achieved, national crop ratings need to exceed 70%. Last year’s same week ratings were 74% with a final yield above trend, so this year’s rating of 67% does not calculate out to a trend+ yield. Our favored model is estimating yield at 181.1. This estimate is based on the state-by-state crop conditions, % of total acres versus national planted total and level of crop stress by state. The model has had good success in recent years following crop conditions to estimate final BPA yield.
- The re-escalation of fighting in Iran and the Straits closing again, is that the political/military faction that is causing the problems (The Islamic Revolutionary Guard) is supported with weapons and food by both China and Russia while the rest of the country is in dire condition. Negotiating with China through a trade deal (that is enacted) will continue to be challenging with China. China buys a lot of Iranian oil, and the Strait’s re-closure may strangely force China to buy more oil. All the cross-currents are overwhelming to calculate.
- The news from Washington on year-round E-15 and any update on a farmer aid package has been slow this week and has not been a price determining factor.
It is hard to say if today’s trade was positive or negative for the overall trends and if China’s developing buying interest will overshadow all other outside news other a massive US weather forecast change. Irreversible damage has been done to the European crops with the top end taken off the US corn crop and Indian grain crops. Determining the extent of the world yield loss will be the hardest job for the next 2-months but if China gets on a US bean purchase pace equal to this week (16-20 MBU), it will make the accuracy of guessing that yield loss even more important. Nervousness for large moves in either direction is definitely present in the market, but the worst-case scenario for the downside has been mitigated.
Sales Targets
Corn
Beans
Wheat
- 2025 Crop Finished Finished Finished
- 100% Sold at $4.48 Avg 100% Sold at $10.67 100% Sold at $6.24 Avg
- 2026 Crop On Hold - Dec ‘26 On Hold – Nov ‘26 On Hold – Sep ‘26
- 60% Sold at $4.78* 50% Sold at $11.05 65% Sold at $6.24
- Current Price $4.55 $11.88 $6.06
- 2027 Crop On Hold - Dec ‘27 On Hold – Nov ‘27 On Hold – July ‘27
- No Sales Yet 10% Sold at $11.50 25% Sold at $7.15
- Current Price $4.80 $11.57 $6.48
%’s are total of expected yields. Bold Prices are Updated Sales Targets. * price includes trading
December Corn – Daily
Today’s Market Closes — Rounded to the Nearest Cent
Corn
- July $4.35
- September $4.35
- December $4.56
- March $4.72
Beans
- July $11.95
- September $11.84
- November $11.92
- January $12.06
Wheat
- July $6.00
- September $6.08
- December $6.23
- March $6.37
Other Closes
- August Diesel 3.6769 +3453
- Dec Cotton 80.67 -62
- Cash Cattle $260 Offer
- Lean Hogs 99.65 +273
Any decision to purchase or sell as a result of the opinions expressed in this report will be the full responsibility of the person authorizing such transaction. No market data or other information is warranted by Reliance Capital Markets II LLC as to completeness or accuracy, express or implied, and is subject to change without notice. Any comments or statements made herein do not necessarily reflect those of Reliance Capital Markets II LLC, or their respective subsidiaries, affiliates, officers or employees. Disclaimer: Past performance is not indicative of future results. Strategic Trading Advisors is a registered DBA of Reliance Capital Markets ll LLC.

About Jody Lawrence
Jody Lawrence has been in the commodity brokerage and agriculture marketing business since 1992 and started Strategic Trading Advisors in 1999 and runs it today with his son Brady. The daily market comment his company publishes has over 7000 subscribers in 33 states and 3 countries and provides a concise overview of the world markets with ideas on farm hedging and marketing. Jody also travels the country giving 60-70 marketing meetings a year through his 22-year strategic partnership with Helena Agri-Enterprises.

About Brady Lawrence
Brady Lawrence is an Agriculture Market Specialist and Financial Advisor that focuses on commodities markets, futures and options brokerage, and helping individuals and families plan for retirement and their financial futures. Brady joined Jody at Strategic Trading Advisors in 2018 after college and supports the market research and brokerage sides of the business.