
- Corn unch to 2 lower
- Soybeans 5 to 1 ½ lower
- Wheat ½ to ¾ higher
- Basis Flat
- Live Cattle 215 higher (246.20)
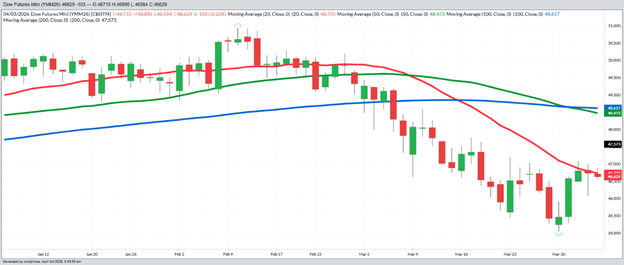
- Dow Jones 103 lower (46,629)
- Crude Oil 716 higher (98.04)
- Feeder Cattle 263 higher (370.63)
Choppiness prevailed in Thursday’s end of week trade as the trade positioned on the latest Iran news and the added uncertainty of the 3-day Easter weekend. Crude oil was sharply higher to end the shortened week but did not pull the grains and soy markets along like it had been the first weeks of the war, as President Trump’s national address on Wednesday night did not offer any clear path or plan for an end to the war or a re-opening of the Straits of Hormuz. Caution and confusion remain key parts of price discovery as last Monday’s USDA planting estimates showed more corn acres than expected but with a survey window before the war started, and fertilizer prices skyrocketed. The markets will re-open on Sunday night with crude and diesel prices sitting at post-Covid highs with any weekend diplomatic or military news determining early week price direction.
News and Notes:
- The central Corn Belt of the Big I states received some welcome pre-planting rain over the last 3-5 days to help areas that saw their driest winter in years. US weather remains spring consistent with highly variable prices, but a general non-threatening outlook into mid-April. The early summer weather pattern features a likely transition from a neutral El Nino to a weak El Nino by pollination. This pattern usually produces trendline + yields. The wheat crop in the S Plains still needs rain. SA weather remains a non-issue as Brazil’s winter corn crop is going through early development in good conditions and Argentina’s harvest is approaching 25% complete with sharply higher yields than last year’s drought impacted crops.
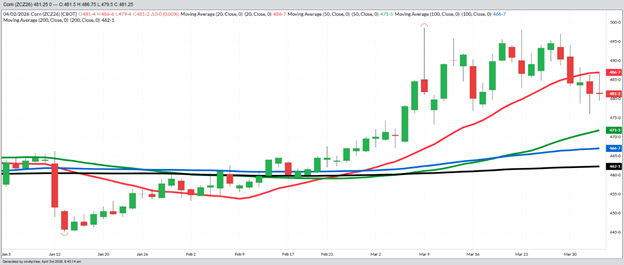
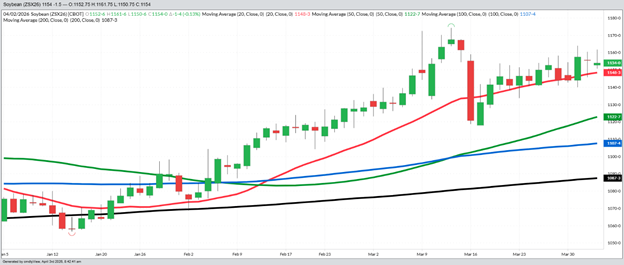
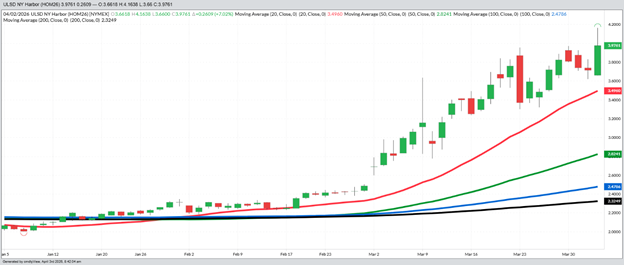
- The new crop corn and bean charts are on Page 2 and show corn’s weakness after the Prospective Planting report while beans remain neutral to bullish on the strength of crude oil and new EPA bio-fuel mandates pulling bean oil higher. The June diesel chart shows the daily volatility of the markets around each new development in Iran and shows the new contract high and new 3 ½ year weekly closing high. The last chart is the Dow Jones Industrial average, and it is clear that equity investors are looking at the current spike in oil prices, a more temporary problem pushing prices higher for the first week since the war started. One key indicator in these fast-moving markets is becoming the 20-DMA (red line) that is following the trade higher or lower.
- Cattle rallied again last week with big rallies to end the week on higher cash trade. The record high prices remain a concern if gas prices stay high for longer as consumer discretionary income is stretched at the pump. Rumors last week were that the Mexican border could reopen soon but for processed beef imports, not for live or feeder cattle. With the weather warming and the grilling season arriving, beef demand at the retail level will closely influence summer price trends.
- Please take a few minutes to listen to our latest podcast on Helena’s FieldLink where fertilizer costs and the markets are discussed as the war continues in Iran.
- Weekly Changes: - 9 3/4 (May ‘26), - 9 (Dec ‘26), Beans + 4 1/4 (May ‘26), + 10 (Nov ‘26), Wheat – 6 1/2 (July ’26), Crude +178, Diesel + 1562, Dow + 1205, US Dollar - 67, Cattle + 770, Feeder Cattle + 823, Hogs - 80, Cotton + 96, Milk + 51 (17.73).
The fog of war continues to sit over all markets as this week’s hope for clarity from the White House proved fruitless. With more questions than answers in the war and the short and long-term impact of higher gas prices all summer, finding fair value for the grains and soy markets will be more challenging than normal but good planting weather almost always leads top more corn acres. The hook in that theory is just how many farmers do not have sufficient fertilizer to use a full fertility program now demanded to outyield low prices. If our markets begin to look past the war and crude oil prices begin to moderate or fall, the concern of increased corn acres of 96 MA + and good growing season weather will take over price discovery. While there are too many crosscurrents to analyze in the short-term, the plan to continue to sell rallies is the best way to go. We hope everyone has a blessed Easter weekend.
December Corn – Daily
November Beans – Daily
June Diesel – Daily
June Dow Jones Equity Index - Daily
Sales Targets
Corn
Beans
Wheat
- 2025 Crop On Hold – May ‘26 Finished Finished
- 90% Sold at $4.45 Avg 100% Sold at $10.67 100% Sold at $6.24 Avg
- Current Price $4.66
- 2026 Crop On Hold - Dec ‘26 On Hold – Nov ‘26 On Hold– July ‘26
- 50% Sold at $4.73 55% Sold at $11.01 50% Sold at $6.13
- Current Price $4.91 $11.41 $6.07
- 2027 Crop On Hold - Dec ‘27 On Hold – Nov ‘27 On Hold– July ‘27
- No Sales Yet No Sales Yet No Sales Yet
- Current Price $4.90 $10.95 $6.45
%’s are total of expected yields. Bold Prices are Updated Sales Targets. * price includes trading
Previous Sales Levels
Corn
Beans
Wheat
-
2024 Sales Sales
May ’25 $4.41 (25% on 9-6-24)
May ’25 $4.55 (25% on 10-1-24)
May ’25 $4.45 (25% on 11-7-24)
May ’25 $4.50 (15% on 12-10-24)
Dec ’25 $4.30 (10% on 9-15-25)Nov ’24 $12.20 (25% on 5-22-24)
May ’25 $10.56 (25% on 9-3-24)
May ’25 $10.80 (25% on 9-23-24)
May ’25 $10.90 (25% on 9-24-24)July ’24 $6.60 (15% on 12-6-23)
July ’24 $6.35 (15% on 5-6-24)
July ’24 $6.65 (15% on 5-10-24)
Dec ’24 $5.80 (20% at 9-4-24)
Dec ’24 $5.95 (20% on 9-13-24)
Dec ’24 $6.10 (15% on 10-2-24) -
2025 Sales Sales
Dec ’25 $4.45 (25% on 11-7-24)
Dec ’25 $4.42 (25% on 12-11-24)
Mar ’26 $4.50 (10% on 10-28-25)
Mar ’26 $4.50 (10% on 12-12-25)
Mar ’26 $4.35 (10% on 2-5-26)
May ’26 $4.55 (10% om 3-6-26)Nov ’25 $10.60 (25% on 9-3-24)
Nov ’25 $10.90 (25% on 9-24-24)
Nov ’25 $10.25 (15% on 1-2-25)
Nov ’25 $10.55 (10% on 8-22-25)
Nov ’25 $10.52 (15% on 10-27-25)
Mar ’26 $11.05 (10% on 10-28-25)July ’25 $7.50 (20% on 5-22-24)
July ’25 $6.35 (25% on 10-1-24)
July ’25 $5.95 (15% on 2-3-25)
Sep ’25 $5.90 (20% on 6-20-25)
Dec ’25 $5.40 (20% on 7-3-25) -
2026 Sales Sales
Dec ’26 $4.75 (10% on 6-20-25)
Dec ’26 $4.70 (10% on 11-14-25)
Dec ’26 $4.70 (10% on 12-2-25)
Dec ‘26 $4.65 (10% on 2-24-26)
Dec ’26 $4.85 (10% on 3-9-26)Nov ’26 $10.75 (15% on 8 21-25)
Nov ’26 $10.95 (10% on 10-27-25)
Nov ’26 $11.30 (10% on 12-2-25)
Nov ’26 $10.90 (10% on 1-28-26)July ’26 $6.45 (25% on 6-20-25)
July ’26 $5.80 (25% on 11-4-25)
Today’s Market Closes — Rounded to the Nearest Cent
Corn
- May $4.52
- July $4.63
- September $4.67
- December $4.81
Beans
- May $11.64
- July $11.80
- September $11.54
- November $11.54
Wheat
- May $5.98
- July $6.10
- September $6.22
- December $6.39
Other Closes
- June Diesel 3.9761 +2609
- Dec Cotton 74.98 -10
- Cash Cattle $240 Trade
- Lean Hogs 90.35 -58
A Complete Overview of Current New Crop Market Conditions
Last Updated: 04/04/2026
Fundamentally
Technically
Short Term
Long Term
Volatility
Trade Rec
- Corn Neut/Bearish Neut/Bearish Neutral Neut/Bearish High Sell Rallies
- Soybeans Neutral Neut/Bearish Neut/Bullish Bearish High Sell Rallies
- Wheat Neut/Bullish Neut/Bearish Neut/Bullish Neut/Bearish High Sell Rallies
- Cattle Neut/Bullish Bullish Neut/Bullish Bearish High Sell Rallies
- Hogs Neutral Neut/Bearish Neut/Bearish Neutral High Sell Rallies
- Diesel Bullish Bullish Bullish Bearish High None
- Denotes positive change
- Denotes negative change
Any decision to purchase or sell as a result of the opinions expressed in this report will be the full responsibility of the person authorizing such transaction. No market data or other information is warranted by Reliance Capital Markets II LLC as to completeness or accuracy, express or implied, and is subject to change without notice. Any comments or statements made herein do not necessarily reflect those of Reliance Capital Markets II LLC, or their respective subsidiaries, affiliates, officers or employees. Disclaimer: Past performance is not indicative of future results. Strategic Trading Advisors is a registered DBA of Reliance Capital Markets ll LLC.

About Jody Lawrence
Jody Lawrence has been in the commodity brokerage and agriculture marketing business since 1992 and started Strategic Trading Advisors in 1999 and runs it today with his son Brady. The daily market comment his company publishes has over 7000 subscribers in 33 states and 3 countries and provides a concise overview of the world markets with ideas on farm hedging and marketing. Jody also travels the country giving 60-70 marketing meetings a year through his 22-year strategic partnership with Helena Agri-Enterprises.

About Brady Lawrence
Brady Lawrence is an Agriculture Market Specialist and Financial Advisor that focuses on commodities markets, futures and options brokerage, and helping individuals and families plan for retirement and their financial futures. Brady joined Jody at Strategic Trading Advisors in 2018 after college and supports the market research and brokerage sides of the business.