
- Corn 1 to 2 ½ lower
- Soybeans ¼ lower to 1 ¼ lower
- Wheat 10 ¾ to 12 ¾ lower
- Basis Flat
- Live Cattle 5 higher (257.45)
- Dow Jones 130 lower (52,209)
- Crude Oil 269 lower (69.23)
- Feeder Cattle 345 lower (369.85)
After Thursday’s potentially key reversal, the week ended with a weaker tone as option expiration, positioning ahead of Monday’s first notice day for July futures, new bombings in Iran and a hot/dry US weather outlook just ahead of Tuesday’s USDA planted acreage update. The growing list of positive and negative market influences will make for a wild trade in July.
News and Notes:
- As of Sunday morning, the forecasts for the Midwest do not extend the brutal heat past eh July 4th weekend, but rain chances drop sharply for the week after the 4th weekend. European forecasts are still very hot/dry with no widespread cooling or rain for their corn and wheat crops.
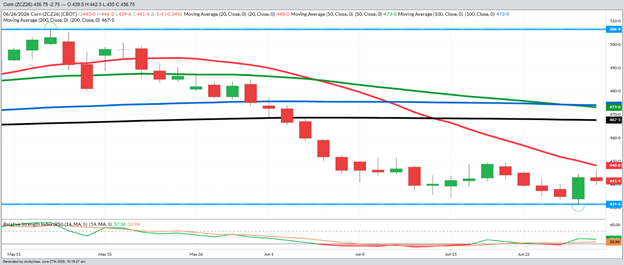
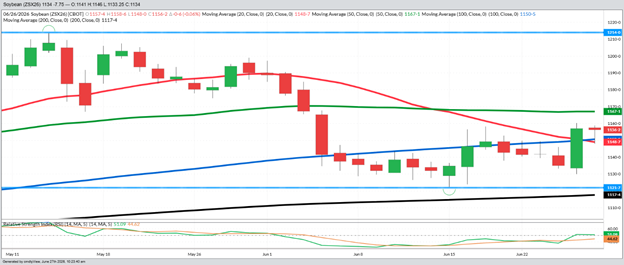
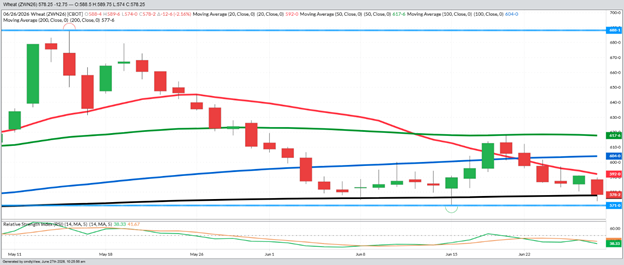
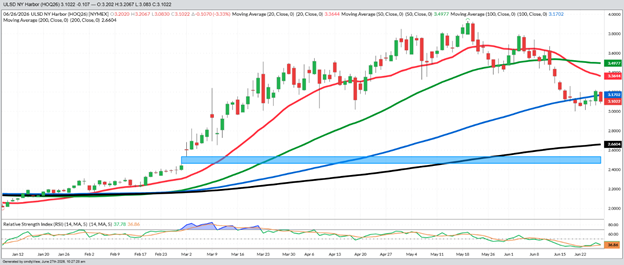
- The daily new crop corn, bean, wheat, and diesel charts are on Page 2 and show the (hopeful) tradable bottom from Thursday’s sharp reversal in corn and beans. Initial overhead resistance in corn is the 20-DMA (red line) at $4.48. Beans have a more bullish set up as they have posted two positive weeks and closed over the 20 and 100 DMA (blue line) for the first time since late May. Wheat looks like it wants to go back and test the recent harvest lows at $5.71 before trying to rebound once the harvest pressure ends. The funds are short 250 MBU of corn, long nearly 300 MBU of beans and short 380 MBU of wheat. The fund positions in the grains make me optimistic that with some bullish news, they have an open door to rally through. Diesel closed under the 100-DMA (blue line) 4 times last week for the first time since early January and could target the open chart gap from $2.46 to $2.53. Friday’s diesel close was $3.10 and already 80+ cents below the May 19th high.
- Private analyst acreage estimates from farmer surveys were released last week with everything from a 1.4 MA increase to corn to a 1.5 MA decrease in corn acres. The average was for a 346,000 acre decrease in corn and 669, 000 acre increase for beans. I will not be surprised if the corn acres some in a little lower than the average estimate because of the surge in fertilizer prices after the war started and the wettest April/May stretches since 2019 for the lower Ohio Valley and the ECB. The USDA report will be released Tuesday at 11 am central and update almost every column on their balance sheets.
- Problems continue to develop with Iran as they fired drones at ships in the Straits and at their neighbor Bahrain. The US did strike several targets in retaliation. While many ships sailed through the Straits last week, not as many are entering the Persian Gulf to return to normal two-way shipping. Most of the fertilizer that made through is heading to China and SA, although US prices have fallen.
- More details and projections are coming out about the impact of year-round E-15 as President Trump pushes for it to be part of the $88 billion supplemental funding package. If passed, the ramp up would add roughly 500 MBU of corn use in 26/27, 1 BBU in 27/28, 1.5 BBU in 28/29, 2 BBU in 29/30, leading to 30/31 where would plateau at 8 BBU of corn used for ethanol annually. The easy math is that for each additional 500 MBU, the US would need to plant an additional 3 MA of 185 BPA yielding corn. Following through to full build out would add up to an additional 18 MA of corn. That would push the US to plant 110-115 MA of total corn acres or go to the world corn market to import the shortage. The thing that has held up year-round E-15 has always been the refineries. Prepare for a fight from them, but the potential for passage to fundamentally change the world corn market is obvious.
- Weekly Changes: Corn - 4 3/4 (July ‘26), - 2 1/2 (Dec ‘26), Beans + 3 1/2 (July ‘26), + 13 1/2 (Nov ‘26), Wheat – 27 1/2 (July ’26), Crude - 561, Diesel - 74, Dow + 201, US Dollar + 1645, Cattle - 67, Feeder Cattle + 325, Hogs + 160 , Cotton - 329, Milk - 6 (16.01).
Monday and Tuesday might be the most impactful two days of trading for the rest of the summer as the USDA Acreage report always comes with fireworks, an extension of the Midwest hot/dry forecast into pollination will ignite a real weather market, first notice day for July futures will pass, and the end of the month and quarter always sees fund positioning in large price moving volume. After several Iranian attacks on ships in the Staits and against neighboring countries, the US bombed Iran’s munition and communication infrastructure. With the Iran/US escalation, crude oil, corn, beans, and wheat opening calls are higher. Any extension of the heat will accelerate those potential gains. Be prepared for a big week of news in the 4-days of trade heading into the 3-day July 4th weekend. Have a great Sunday.
December Corn – Daily
November Beans – Daily
July Wheat - Daily
August Diesel – Daily
Sales Targets
Corn
Beans
Wheat
- 2025 Crop Finished Finished Finished
- 100% Sold at $4.48 Avg 100% Sold at $10.67 100% Sold at $6.24 Avg
- 2026 Crop On Hold - Dec ‘26 On Hold – Nov ‘26 On Hold– July ‘26
- 60% Sold at $4.78 50% Sold at $11.05 65% Sold at $6.24
- Current Price $4.42 $11.56 $5.78
- 2027 Crop On Hold - Dec ‘27 On Hold – Nov ‘27 On Hold– July ‘27
- No Sales Yet 10% Sold at $11.50 25% Sold at $7.15
- Current Price $4.74 $11.35 $6.38
%’s are total of expected yields. Bold Prices are Updated Sales Targets. * price includes trading
Previous Sales Levels
Corn
Beans
Wheat
-
2025 Sales Sales
Dec ’25 $4.45 (25% on 11-7-24)
Dec ’25 $4.42 (25% on 12-11-24)
Mar ’26 $4.50 (10% on 10-28-25)
Mar ’26 $4.50 (10% on 12-12-25)
Mar ’26 $4.35 (10% on 2-5-26)
May ’26 $4.55 (10% on 3-6-26)
July ’26 $4.75 (10% on 5-1-26)Nov ’25 $10.60 (25% on 9-3-24)
Nov ’25 $10.90 (25% on 9-24-24)
Nov ’25 $10.25 (15% on 1-2-25)
Nov ’25 $10.55 (10% on 8-22-25)
Nov ’25 $10.52 (15% on 10-27-25)
Mar ’26 $11.05 (10% on 10-28-25)July ’25 $7.50 (20% on 5-22-24)
July ’25 $6.35 (25% on 10-1-24)
July ’25 $5.95 (15% on 2-3-25)
Sep ’25 $5.90 (20% on 6-20-25)
Dec ’25 $5.40 (20% on 7-3-25) -
2026 Sales Sales
Dec ’26 $4.75 (10% on 6-20-25)
Dec ’26 $4.70 (10% on 11-14-25)
Dec ’26 $4.70 (10% on 12-2-25)
Dec ‘26 $4.65 (10% on 2-24-26)
Dec ’26 $4.85 (10% on 3-9-26)
Dec ’26 $5.05 (10% on 5-5-26)Nov ’26 $10.75 (15% on 8 21-25)
Nov ’26 $10.95 (10% on 10-27-25)
Nov ’26 $11.30 (10% on 12-2-25)
Nov ’26 $10.90 (10% on 1-28-26)
Nov ’26 $11.90 (5% on 5-4-26)July ’26 $6.45 (25% on 6-20-25)
July ’26 $5.80 (25% on 11-4-25)
July ’26 $6.60 (15% on 5-12-26) -
2027 Sales Sales
No Sales Yet
Nov ’27 $11.50 (10% on 5-4-26)
July ’27 $7.15 (25% on 5-12-26)
Today’s Market Closes — Rounded to the Nearest Cent
Corn
- July $4.13
- September $4.22
- December $4.42
- March $4.57
Beans
- July $11.26
- September $11.41
- November $11.56
- January $11.71
Wheat
- July $5.78
- September $5.90
- December $6.07
- March $6.22
Other Closes
- August Diesel 3.122 -1070
- Dec Cotton 76.38 -59
- Cash Cattle $260 Trade
- Lean Hogs 96.58 -3
A Complete Overview of Current New Crop Market Conditions
Last Updated: 06/28/2026
Fundamentally
Technically
Short Term
Long Term
Volatility
Trade Rec
- Corn Neut/Bullish Neut/Bullish Neut/Bullish Neut/Bullish High Sell Rallies
- Soybeans Neut/Bullish Neutral Neut/Bearish Neut/Bullish High Sell Rallies
- Wheat Neutral Bearish Neutral Neut/Bullish High Sell Rallies
- Cattle Neut/Bullish Bullish Neutral Neut/Bullish High Sell Rallies
- Hogs Neut/Bearish Bearish Neut/Bearish Neutral Medium Sell Rallies
- Diesel Neut/Bearish Bearish Neut/Bullish Bearish High None
- Denotes positive change
- Denotes negative change
Any decision to purchase or sell as a result of the opinions expressed in this report will be the full responsibility of the person authorizing such transaction. No market data or other information is warranted by Reliance Capital Markets II LLC as to completeness or accuracy, express or implied, and is subject to change without notice. Any comments or statements made herein do not necessarily reflect those of Reliance Capital Markets II LLC, or their respective subsidiaries, affiliates, officers or employees. Disclaimer: Past performance is not indicative of future results. Strategic Trading Advisors is a registered DBA of Reliance Capital Markets ll LLC.

About Jody Lawrence
Jody Lawrence has been in the commodity brokerage and agriculture marketing business since 1992 and started Strategic Trading Advisors in 1999 and runs it today with his son Brady. The daily market comment his company publishes has over 7000 subscribers in 33 states and 3 countries and provides a concise overview of the world markets with ideas on farm hedging and marketing. Jody also travels the country giving 60-70 marketing meetings a year through his 22-year strategic partnership with Helena Agri-Enterprises.

About Brady Lawrence
Brady Lawrence is an Agriculture Market Specialist and Financial Advisor that focuses on commodities markets, futures and options brokerage, and helping individuals and families plan for retirement and their financial futures. Brady joined Jody at Strategic Trading Advisors in 2018 after college and supports the market research and brokerage sides of the business.