
Current Trade: Corn: 10 to 6 lower ($4.31 to $4.67)
Beans: 15 to 7 lower ($11.32 to $11.16)
Wheat: 9 to 11 lower ($5.27 to $5.65)
First Glance:
Corn
2025 US Corn Yield: 186 BPA (184 BPA Estimate)
2025 US Corn Production: 16.752 BBU (16.557 BBU Estimate)
25/26 US Corn Stocks: 2.154 BBU (2.136 BBU Estimate)
25/26 World Corn Stocks: 281.34 MMT (282.75 MMT Estimate)
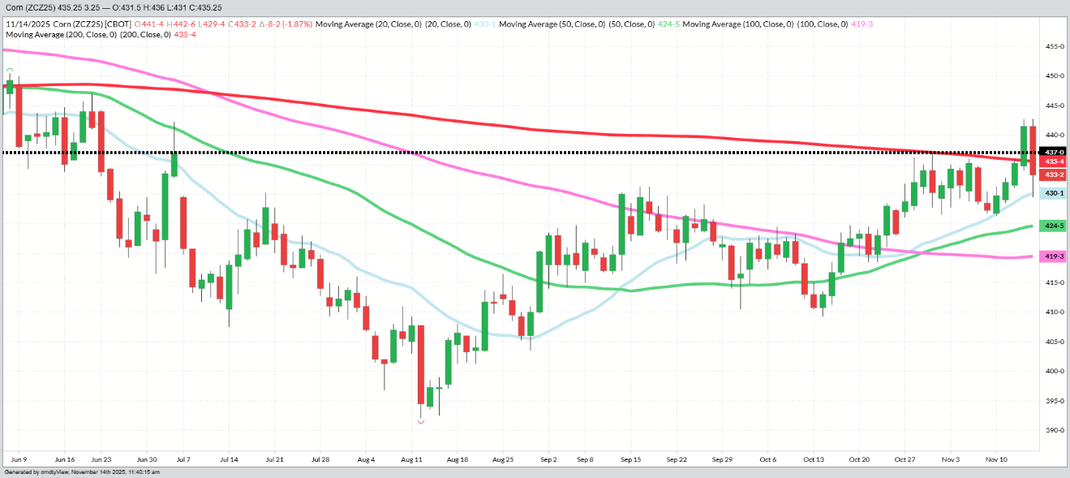
- Despite the late season crop problems of drought and rust, the USDA did not find the corn yield loss that was expected and published a larger than expected yield of 186 BPA. With higher production came higher US ending stocks, but those were not raised as much as yield as corn exports and domestic industrial demand has been exceptional this fall. The chart still looks constructive, but after a 33-cent one month rally, the market will take a breather on these numbers, but fortunately, in a new higher range.
Beans
2025 US Bean Yield: 53 BPA (53.1BPA Estimate)
2025 US Bean Production: 4.253 BBU (4.266 BBU Estimate)
25/26 US Bean Stocks: 290 MBU (304 MBU Estimate)
25/26 World Bean Stocks: 121.99 MMT (124.21 MMT Estimate)
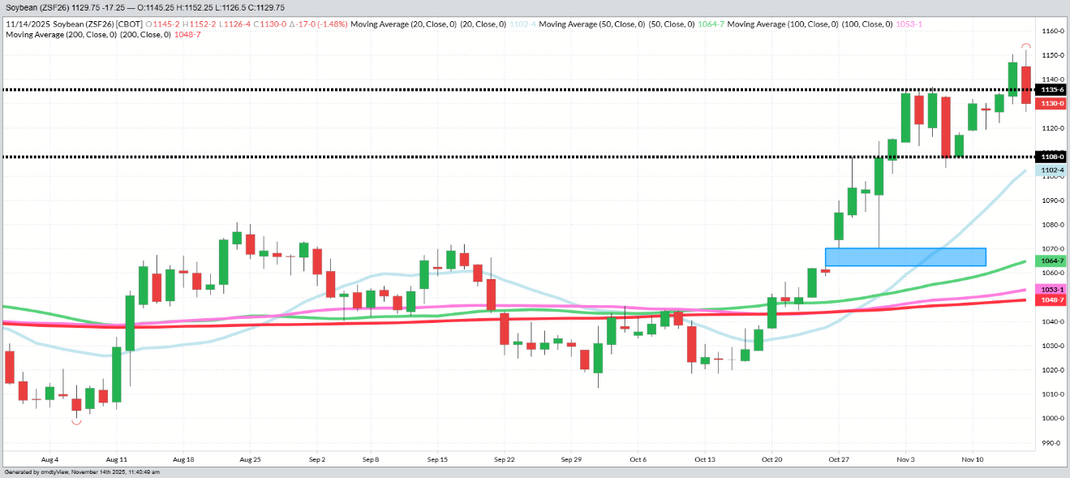
- The bean market had the most to lose and it is taking a hit, but not as bad as it would have been if the bean yield number were as surprising as the corn yield. The bean yield was flat to estimates. The interesting number in the report was the US held beans imports to China unchanged at 112 MMT (4.1 BBU) for the 25/26 marketing year. Also, a USDA flash sale report did show sales of 1.1 MBU +/- to China around the time the trade deal was in the works. The delayed data is hard to fit into the matrix of news, but China is buying something which is good. THE chart took a hit today and it is just a matter of where prices might consolidate or will the next downside target be the 20-DMA (blue line at $11.02 1/2) 30-cents below the market and then the open trade deal chart gap at $10.64.
Wheat
25/26 US Wheat Stocks: 901 MBU (867 MBU Estimate)
25/26 World Wheat Stocks: 271.43 MMT (266.13 MMT Estimate)
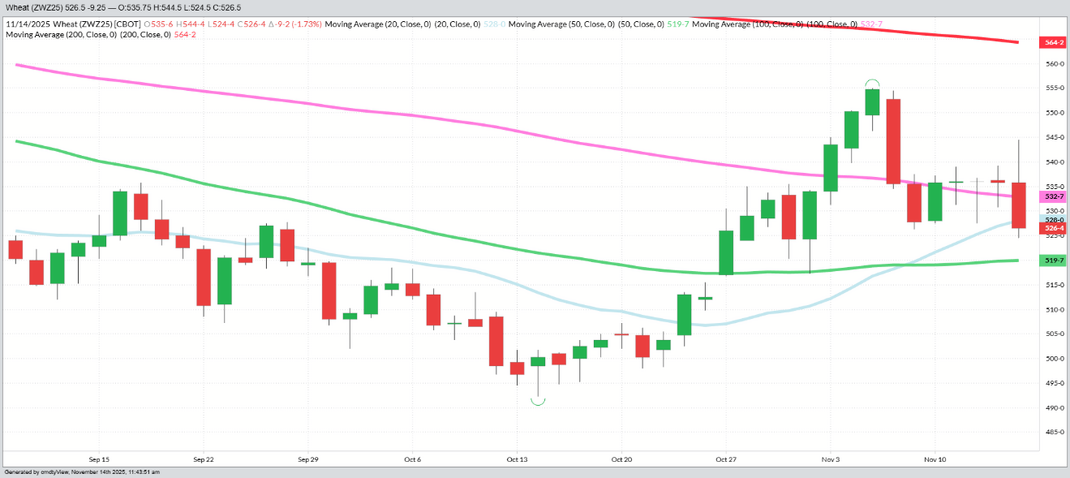
- The wheat numbers were bearish as domestic and world stocks continue to climb on record world yields in all producing countries and exporters finding exports difficult to come by even at rock bottom prices. Wheat will remain an anchor on corn rallies.
Overview:
Counting on the USDA to support your bullish trading or hedge plan never seems to be a good idea as they came in with a larger than expected 2025 corn yield and a similar bean yield to pre-report estimates. The yield bulls are already pointing to all the late season factors which cost yield, all of which are true, but the markets trade the USDA numbers. Prices initially tanked with Dec ’25 corn down 12 at the lows while Jan ’26 beans were 21 lower at their lows. Wheat is also not trading well on larger stocks’ numbers, and the chart points toward new contract lows before the end of 2025.
From earlier today:
SALES ALERT - 2026 CORN
OVERNIGHT TRADE HIT THE 2026 CORN SALES TARGET TO SELL ANOTHER 10% OF 2026 CORN AT $4.70 AGAINST THE DECEMBER CONTRACTS. THIS WILL BRING YOUR 2026 SALES TO 20% WITH A $4.73 AVERAGE.
It was good to get more sales on the books before the report because with the USDA you just never know. While the initial reaction to today’s report is bearish, we will have to wait until the rest of the world opens on Sunday night and Monday for their reaction before we know the full scope of the numbers. There is a long way to go in the SA growing season, but their conditions remain too good to ignore. This will be this weekend’s only report and we will break down the report further on Monday.
Have a great weekend.
December 2025 Corn
January 2026 Beans
December 2025 Wheat
Any decision to purchase or sell as a result of the opinions expressed in this report will be the full responsibility of the person authorizing such transaction. No market data or other information is warranted by Reliance Capital Markets II LLC as to completeness or accuracy, express or implied, and is subject to change without notice. Any comments or statements made herein do not necessarily reflect those of Reliance Capital Markets II LLC, or their respective subsidiaries, affiliates, officers or employees. Disclaimer: Past performance is not indicative of future results. Strategic Trading Advisors is a registered DBA of Reliance Capital Markets ll LLC.

About Jody Lawrence
Jody Lawrence has been in the commodity brokerage and agriculture marketing business since 1992 and started Strategic Trading Advisors in 1999 and runs it today with his son Brady. The daily market comment his company publishes has over 7000 subscribers in 33 states and 3 countries and provides a concise overview of the world markets with ideas on farm hedging and marketing. Jody also travels the country giving 60-70 marketing meetings a year through his 22-year strategic partnership with Helena Agri-Enterprises.

About Brady Lawrence
Brady Lawrence is an Agriculture Market Specialist and Financial Advisor that focuses on commodities markets, futures and options brokerage, and helping individuals and families plan for retirement and their financial futures. Brady joined Jody at Strategic Trading Advisors in 2018 after college and supports the market research and brokerage sides of the business.