
Current Trade:
Corn: 28 to 10 lower Dec futures: $4.70
Beans: 16 to 10 lower Nov futures: $12.74
Wheat: 17 to 20 lower Dec futures: $6.64
First Glance:
Corn
2026 US Corn Yield: 181.2 BPA (177.7 BPA Estimate)
2026 US Total Production: 16.034 BBU (15.721 BBU Estimate)
26/27 US Corn Stocks: 1.849 BBU (1.670 BBU Estimate)
26/27 World Corn Stocks: 276.0 MMT (273.78 MMT)
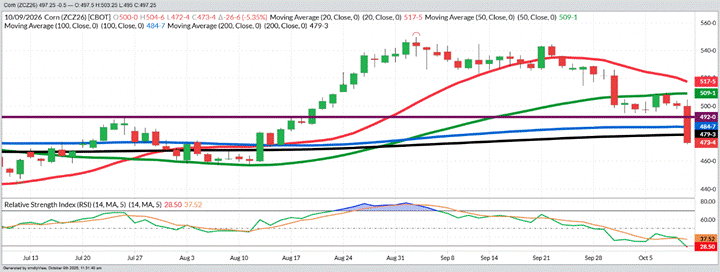
- The USDA/WASDE report did exactly what no one thought was possible by raising yield in today’s report. Not only did they raise it, but they also raised it by 2.7 BPA to 181.2 which raised total yield by 234 MBU from last month’s estimate. This is the second largest yield increase from Sep to Oct since 1990. In the last 10-days, the USDA unexpectedly “found” 407 MBU of corn which has proven too much for the market to withstand and falling over 75-cents from the contract highs. With prices collapsing to new 2-month lows and prices falling through all technical support, the chart looks terrible with the funds still holding a sizable, long position in a bearish market.
Beans
2026 US Bean Yield: 53.1 BPA (52.8 BPA Estimate)
2026 US Total Production: 4.562 (4.534 BBU Estimate)
26/27 US Bean Stocks: 315 BBU (305 BBU Estimate)
26/27 World Bean Stocks: 124.3 MMT (123.33 MMT Estimate)
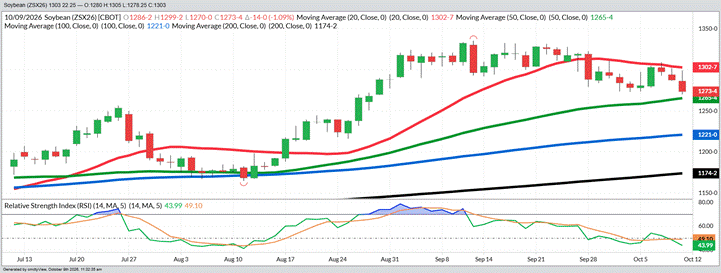
- The bean numbers were not as bearish as corn, but they were also a bearish surprise with yield creeping back over 53 BPA to 53.1 which is up .3 BPA from September but cut harvested acres. Chinese demand and a SA weather story are needed for beans to have any reason to trade significantly over $14 into year end. The chart is damaged but not as bad as corn or wheat.
Wheat
26/27 US Wheat Stocks: 740 MMT (721 MMT Estimate)
26/27 World Wheat Stocks: 276.0 MMT (273.78 MMT Estimate)
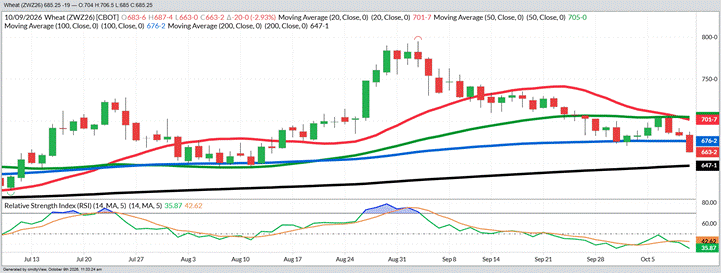
- Wheat stocks in both the US and world were raised modestly but wheat is following corn lower. Wheat has fallen to new 2-month lows.
Overview:
The last month plus has been as bad for the markets as any harvest 6-week stretch that I can remember with every aspect of on-farm income undermined by USDA reports. There may be a few perma-bears in the industry that had yield rising in this report, but the total number of corn bushels that have been added cannot be overcome by a little more demand. It will be very interesting to see what the USDA/WASDE put out in their November and January yield updates, but if they reverse today’s increase, it will be too late for the October fall insurance average. Averages that were expected to be well over the February numbers of $4.62 for and corn and $11.09 for beans will now be less than 20-cents over that for corn but still a respectable $1.60 +/- over for beans. Fear of the USDA is a tough thing to constantly live with when you are farming, but their level of incompetence may have hit a new level in the last 2-months. This will be this weekend’s only report because digging further into the numbers will only be more depressing. Have a great weekend.
December 2026 Corn – Brutally Bearish
November 2026 Beans – Neutral/Bearish
December 2026 Wheat – Very Bearish
Any decision to purchase or sell as a result of the opinions expressed in this report will be the full responsibility of the person authorizing such transaction. No market data or other information is warranted by Reliance Capital Markets II LLC as to completeness or accuracy, express or implied, and is subject to change without notice. Any comments or statements made herein do not necessarily reflect those of Reliance Capital Markets II LLC, or their respective subsidiaries, affiliates, officers or employees. Disclaimer: Past performance is not indicative of future results. Strategic Trading Advisors is a registered DBA of Reliance Capital Markets ll LLC.

About Jody Lawrence
Jody Lawrence has been in the commodity brokerage and agriculture marketing business since 1992 and started Strategic Trading Advisors in 1999 and runs it today with his son Brady. The daily market comment his company publishes has over 7000 subscribers in 33 states and 3 countries and provides a concise overview of the world markets with ideas on farm hedging and marketing. Jody also travels the country giving 60-70 marketing meetings a year through his 22-year strategic partnership with Helena Agri-Enterprises.

About Brady Lawrence
Brady Lawrence is an Agriculture Market Specialist and Financial Advisor that focuses on commodities markets, futures and options brokerage, and helping individuals and families plan for retirement and their financial futures. Brady joined Jody at Strategic Trading Advisors in 2018 after college and supports the market research and brokerage sides of the business.